Other Blog
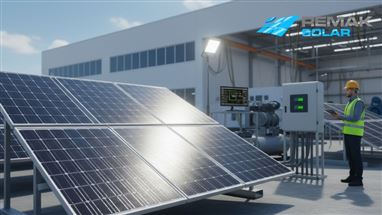

Whether solar panels are working can be understood in a short time with a few simple methods. One of the clearest indicators is the digital display or LED lights on the inverter device. If the system is active, the inverter shows a green light or production values appear on the screen. If there is no data at all, there may be a malfunction in the panel system, a connection issue, or a shading problem. Especially if there is no production on a sunny day, it indicates that the system is not in operation.
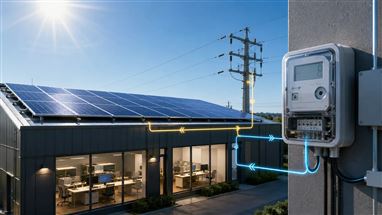
Thanks to energy monitoring systems used in homes or workplaces, the real-time production information of the solar panel can be tracked. These systems clearly show the user how much electricity is produced at which hour and how much energy is sent to the grid. Production being close to zero or completely stopped clearly indicates that the panel is not working. In such cases, connections, inverter settings, or whether there is a physical obstruction on the panel surface should be checked.
In addition, the expected decrease not occurring on the electricity bill may indicate a problem in the system. Especially after the solar panel installation, consumption data should be monitored regularly. If the expected performance is not achieved, it is important to have the system tested by a professional technical service. Such inspections play a critical role not only in detecting malfunctions but also in ensuring the long-term sustainability of panel efficiency.
What Are the Signs That Solar Panels Are Working?
The signs that solar panels are working provide important clues to understand whether the system is producing energy correctly. During daylight hours, when sunlight reaches the panel surface, the system automatically switches on. The simplest way to understand this is to look at the display or indicator lights on the inverter device. If a production value appears on the screen or the green light is on, it means the solar panels are generating energy. Moreover, if the inverter operates audibly or a slight vibration is felt, this is another technical indicator supporting that the system is active.
Common signs that solar panels are working:
- Seeing energy production in watts on the inverter screen
- Green LED light on the inverter being lit
- An upward trend in the production graph on smart monitoring systems
- Numbers on the meter moving forward during the day
- A decrease in consumption on the electricity bill
- No physical issues on the panel surface and a sense of warming
- No power outages in the home or business where the system is installed
All these signs show that the solar panel system is active and transferring energy to the grid or storage system. However, these indicators should be observed regularly, and it should be checked whether there are fluctuations in production over time. Noticed drops in efficiency may indicate that the system is not operating at full capacity, and early intervention can prevent larger problems.
How to Interpret Inverter Light and Screen Warnings?
The lights and screen warnings on the inverter provide clear information about the current status of the solar energy system. The device usually has three different colored LED lights: green, yellow, and red. The green light indicates that the system is active and energy production is ongoing. The yellow light is usually a warning; there may be a slight imbalance in the system, low voltage, or a temporary communication issue. The red light indicates that the system is not working or that a significant fault has been detected. Along with these warnings, error codes on the screen also make it easier to reach the details of the problem.
Meanings of the lights and screen indicators on the inverter:
- Green light: The system is operating normally; energy production continues
- Yellow light: Low production, connection interruption, or temporary fault condition
- Red light: Serious fault; production may have stopped
- “Watt” or “kW” value on the screen: Shows instantaneous production
- Error codes (e.g., “Error 302”): Indicate the type of fault that needs to be checked by technical service
- Sun icon, battery or grid icons: Visualize the direction of energy flow
By regularly monitoring these indicators, you can obtain real-time information about the system’s status. Especially if there is a drop in production values on sunny days, checking the light and screen warnings is important for early intervention. The explanations of error codes in the inverter’s user manual allow some problems to be solved at the user level. However, a system that gives constant errors along with a red light must be inspected by a qualified technical service.
How Are Solar Panel Production Data Tracked?
Solar panel production data can be tracked directly via the inverter, as well as controlled through online monitoring platforms in advanced systems. The digital display of the inverter shows the instantaneous production amount in watts or kilowatts. In addition, daily, weekly, or monthly total production data can be viewed through the menu. Sudden drops in production amounts or prolonged zero values may indicate a disruption in system performance. This screen monitoring provides the user with quick and direct information about the system’s basic operating pattern.
Thanks to smart monitoring systems, solar energy data can be monitored remotely via mobile applications or web interfaces. Through this software, it is also possible to access details such as intraday graphs, the amount of energy fed into the grid, and energy consumption. In some systems, parameters such as weather conditions, panel temperature, and inverter voltage values are integrated in addition to production data. Thus, not only production but also the overall health of the system can be monitored. Regular tracking of data offers great advantages for maximum efficiency and early diagnosis before faults occur.
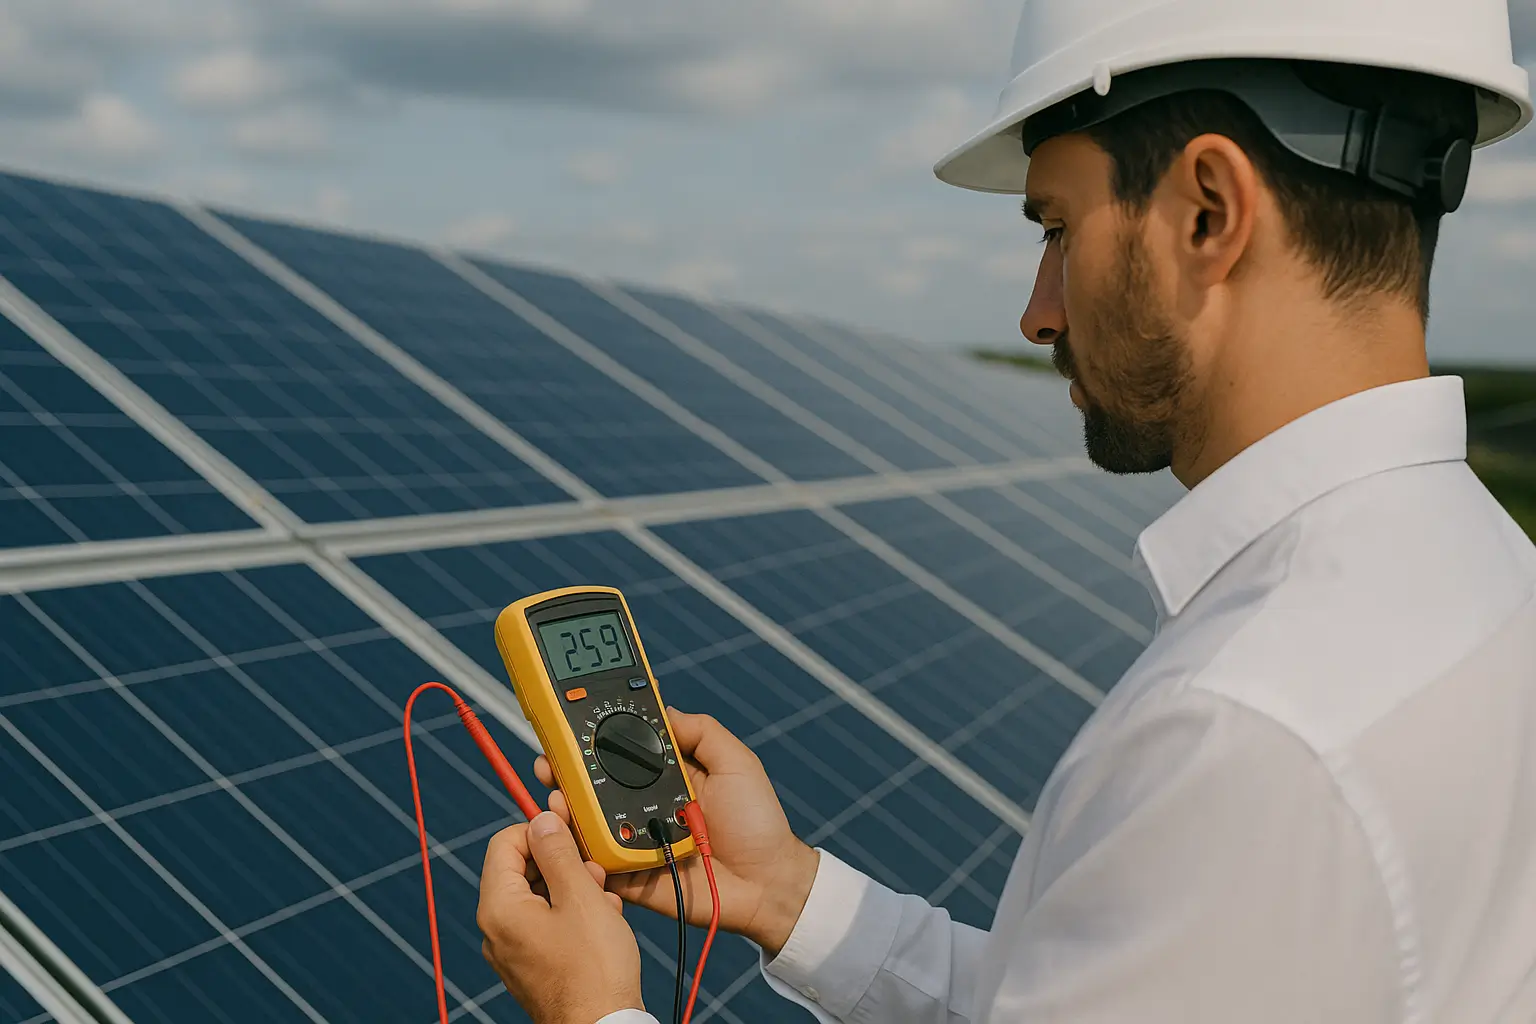
How to Measure Solar Panel Voltage and Current with a Multimeter?
Measuring solar panel voltage and current with a multimeter is one of the most practical methods to assess the system’s basic performance. Before taking measurements, make sure the panel is receiving direct sunlight. First, if measuring voltage, set the multimeter to DC voltage mode and touch the probes to the panel’s output terminals. The value shown on the screen indicates the panel’s open-circuit voltage. For current measurement, set the multimeter to DC current mode and route the panel’s positive line through the multimeter in series to take the measurement.
Points to consider when measuring solar panel voltage and current with a multimeter:
- Set the multimeter to DC mode before measurement
- Connect probes in parallel for voltage; use a series connection for current
- Do not measure under shading or low-light conditions
- The voltage value should be close to the open-circuit voltage on the panel label
- Be careful not to short-circuit during current measurement
- Be careful during measurement; do not mix up the + and – terminals
- Do not measure on wet surfaces or in humid weather conditions
Such checks are extremely useful for understanding whether the panel is active and whether it technically delivers the expected efficiency. Especially after a new installation or when there is a drop in production values, measurements made with a multimeter provide a correct starting point to identify where the system is failing. When performed simply and correctly, it also saves time and cost by protecting the user from unnecessary service calls.
Solar Panel Voltage and Current Measurements (According to Changes in Solar Irradiance)
X-Axis: Solar Irradiance Level (W/m²)
Y-Axis: Measurement Values (Voltage - V, Current - A)
Data: In a hypothetical scenario, voltage and current measurements by solar irradiance levels:
- 200 W/m²: Voltage 20 V, Current 2 A
- 400 W/m²: Voltage 25 V, Current 4 A
- 600 W/m²: Voltage 30 V, Current 6 A
- 800 W/m²: Voltage 35 V, Current 8 A
- 1000 W/m²: Voltage 40 V, Current 10 A
Purpose: To show how measurements taken with a multimeter change as solar irradiance increases.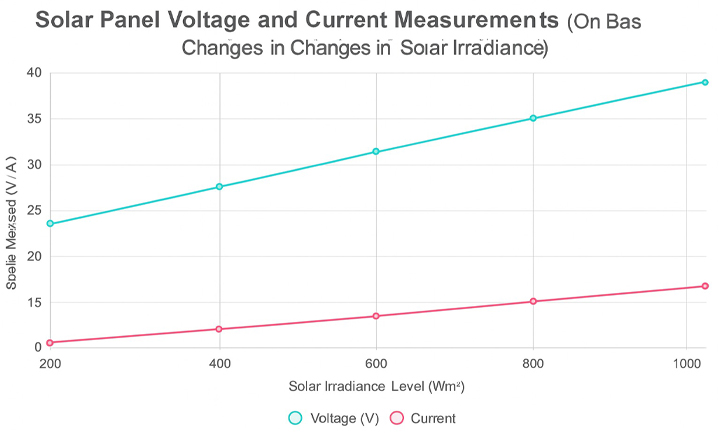
This line chart shows how the voltage and current values measured with a multimeter increase as solar irradiance levels rise. For example, while voltage is 20 V and current is 2 A at 200 W/m², these values reach 40 V and 10 A, respectively, at 1000 W/m². This indicates that the solar panel is operating under optimal conditions and that measurements with a multimeter can verify accuracy. If the values are lower than expected, there may be a fault in the panel or a connection issue.
What Are the Physical Signs Indicating Solar Panel Failures?
Physical signs indicating solar panel failures, if noticed before a performance loss occurs in the system, can prevent serious issues. Visible damage on the panel surface, looseness at connection points, cable deformation, or color changes can cause disruptions in system operation. Such signs may indicate the pressure panels are exposed to from external factors or deterioration occurring in internal components. Regular visual inspection both preserves efficiency and provides the opportunity for early intervention to prevent larger faults.
Physical signs indicating solar panel failures:
- Cracks, breaks, or holes on the panel surface
- Fogging or yellowing under the glass
- Noticeable color differences between cells
- Cracking, melting, or burn marks on cable insulation
- Looseness or water accumulation in junction boxes
- Rust on mounting hardware or structural bending
- Unusual temperature differences around the panel (hot spot formation)
Such physical signs should not be ignored and should be brought under control without delay. Even if panel performance has not yet dropped, a structural problem will negatively affect production capacity in the long term. In particular, cracked glass or loose connections both reduce energy production and pose a safety risk. For the solar panel system to operate safely and with longevity, paying attention to these physical indicators during periodic inspections is of great importance.
How to Detect the Impact of Shading and Soiling on Panel Efficiency?
The impact of shading and soiling on panel efficiency becomes clearly evident through drops in production values. Especially even a portion of the panel being shaded can significantly reduce the production capacity of the entire system. Cells connected in series produce as much energy as the weakest link in the chain. Therefore, just a few leaves, bird droppings, or a shadow cast by a chimney can lead to significant losses in watts. The effect of soiling generally develops over time; when production data is monitored regularly, lower values begin to be observed under the same weather conditions.
The most effective way to understand there is an efficiency loss is to compare energy values obtained on sunny days with previous measurements. If instantaneous production data is lower than expected and there is no technical fault in the system, a layer of dirt accumulating on the panel surface or a shading factor should be considered. Especially partial shadows falling on the panel during morning and evening hours directly affect cell performance. Regular cleaning and control of environmental obstructions are critically important to prevent such efficiency losses. Conducting physical inspections along with performance monitoring supports the long-term healthy operation of the system.
Do Comment